Chart of the Week looks back on 2016 freight load factors
20 / 02 / 2017

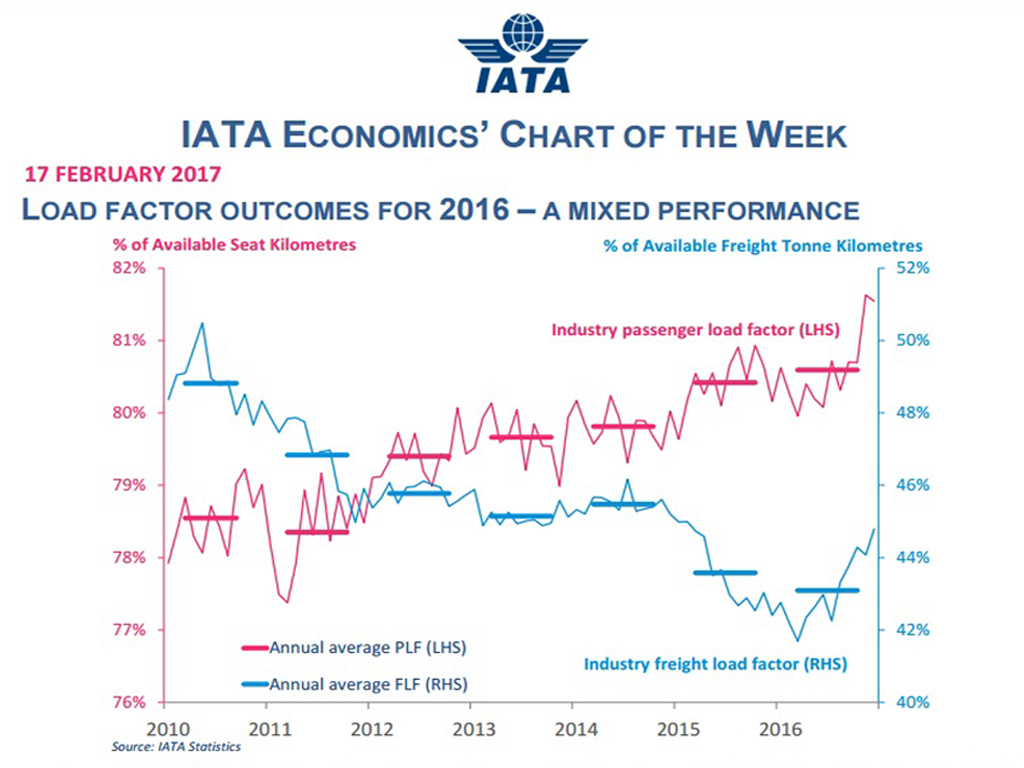
IATA has produced its latest Chart of the Week (COTW), which focused on ‘asset utilisation’ – namely, aircraft load factors.
According to the COTW, despite a strong pick-up in the (seasonally adjusted) freight load factor during the second half of 2016 – due to stronger demand and only moderate cargo capacity growth – the annual average load factor for 2016 was still 0.6 percentage points below that of 2015, ending the year at 43.0%.
Although the strong second-half performance is cause for a degree of optimism that this year will see an improved load factor, it was still not a great result for 2016, the trade body points out.
Moreover, there were significant regional deviations in last year’s freight load factors. Only European carriers registered an annual increase, up a modest 0.4 percentage points on the 2015 figure.
Unsurprisingly, Asia Pacific airlines registered the highest load factor, at 52.8% for over 2016, more than double that of African carriers, at just 22.2%.
Moreover, African carrier’s freight load factor fell sharply in 2016 – by 5 percentage points – due to big increases in available cargo capacity (20% year on year), driven by long-haul service expansion on the part of African carriers (most notably, Ethiopian Airlines).


